Analytics
The Analytics section in eRaay provides standard tabulations/charts that can be generated on demand.
Output Types
The following outputs can be generated through eRaay Analytics:
- Pie Chart
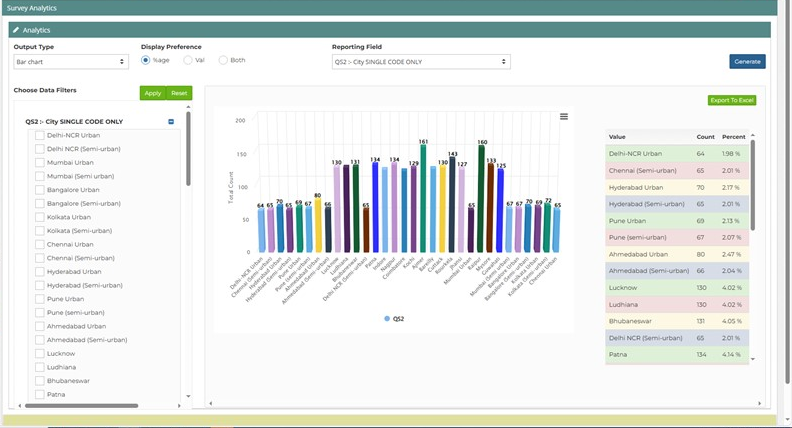
- Bar Chart
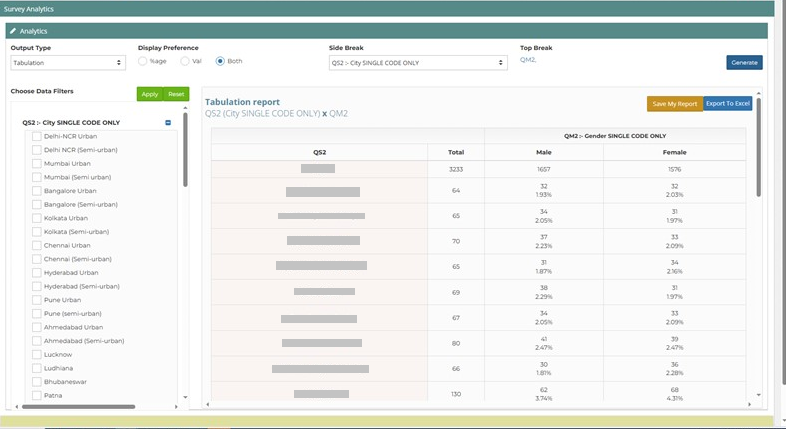
- Tabulation
Generating Report
In order to generate the report you need to need to follow the following steps:
- Choose Output Type
- Choose display preference
- Choose Reporting Column for charts and choose side break and top break for tabulation
- Choose any data filters
- Click on Generate
Saving Outputs
The output can be downloaded to the available data formats (png/pdf/excel)
Sample Screenshots
Bar Chart

Pie Chart

Tabulation

Applying data filters
Coming Soon …

